Building Knowledge Graph To Brain
Description and motivation
It has been a while since I had spent time on structuring and orgranizing the projects and exploring the new things (at least for me).
I am tagging: #knowledge-graph-brain #knowledge-graph #graph-brain #knowledge-graph-management #knowledge-graph-management cause it is a new topic for me.
A side part of Second Brain to help us to understand from the portion of my brain what I have been doing and what I are doing next.
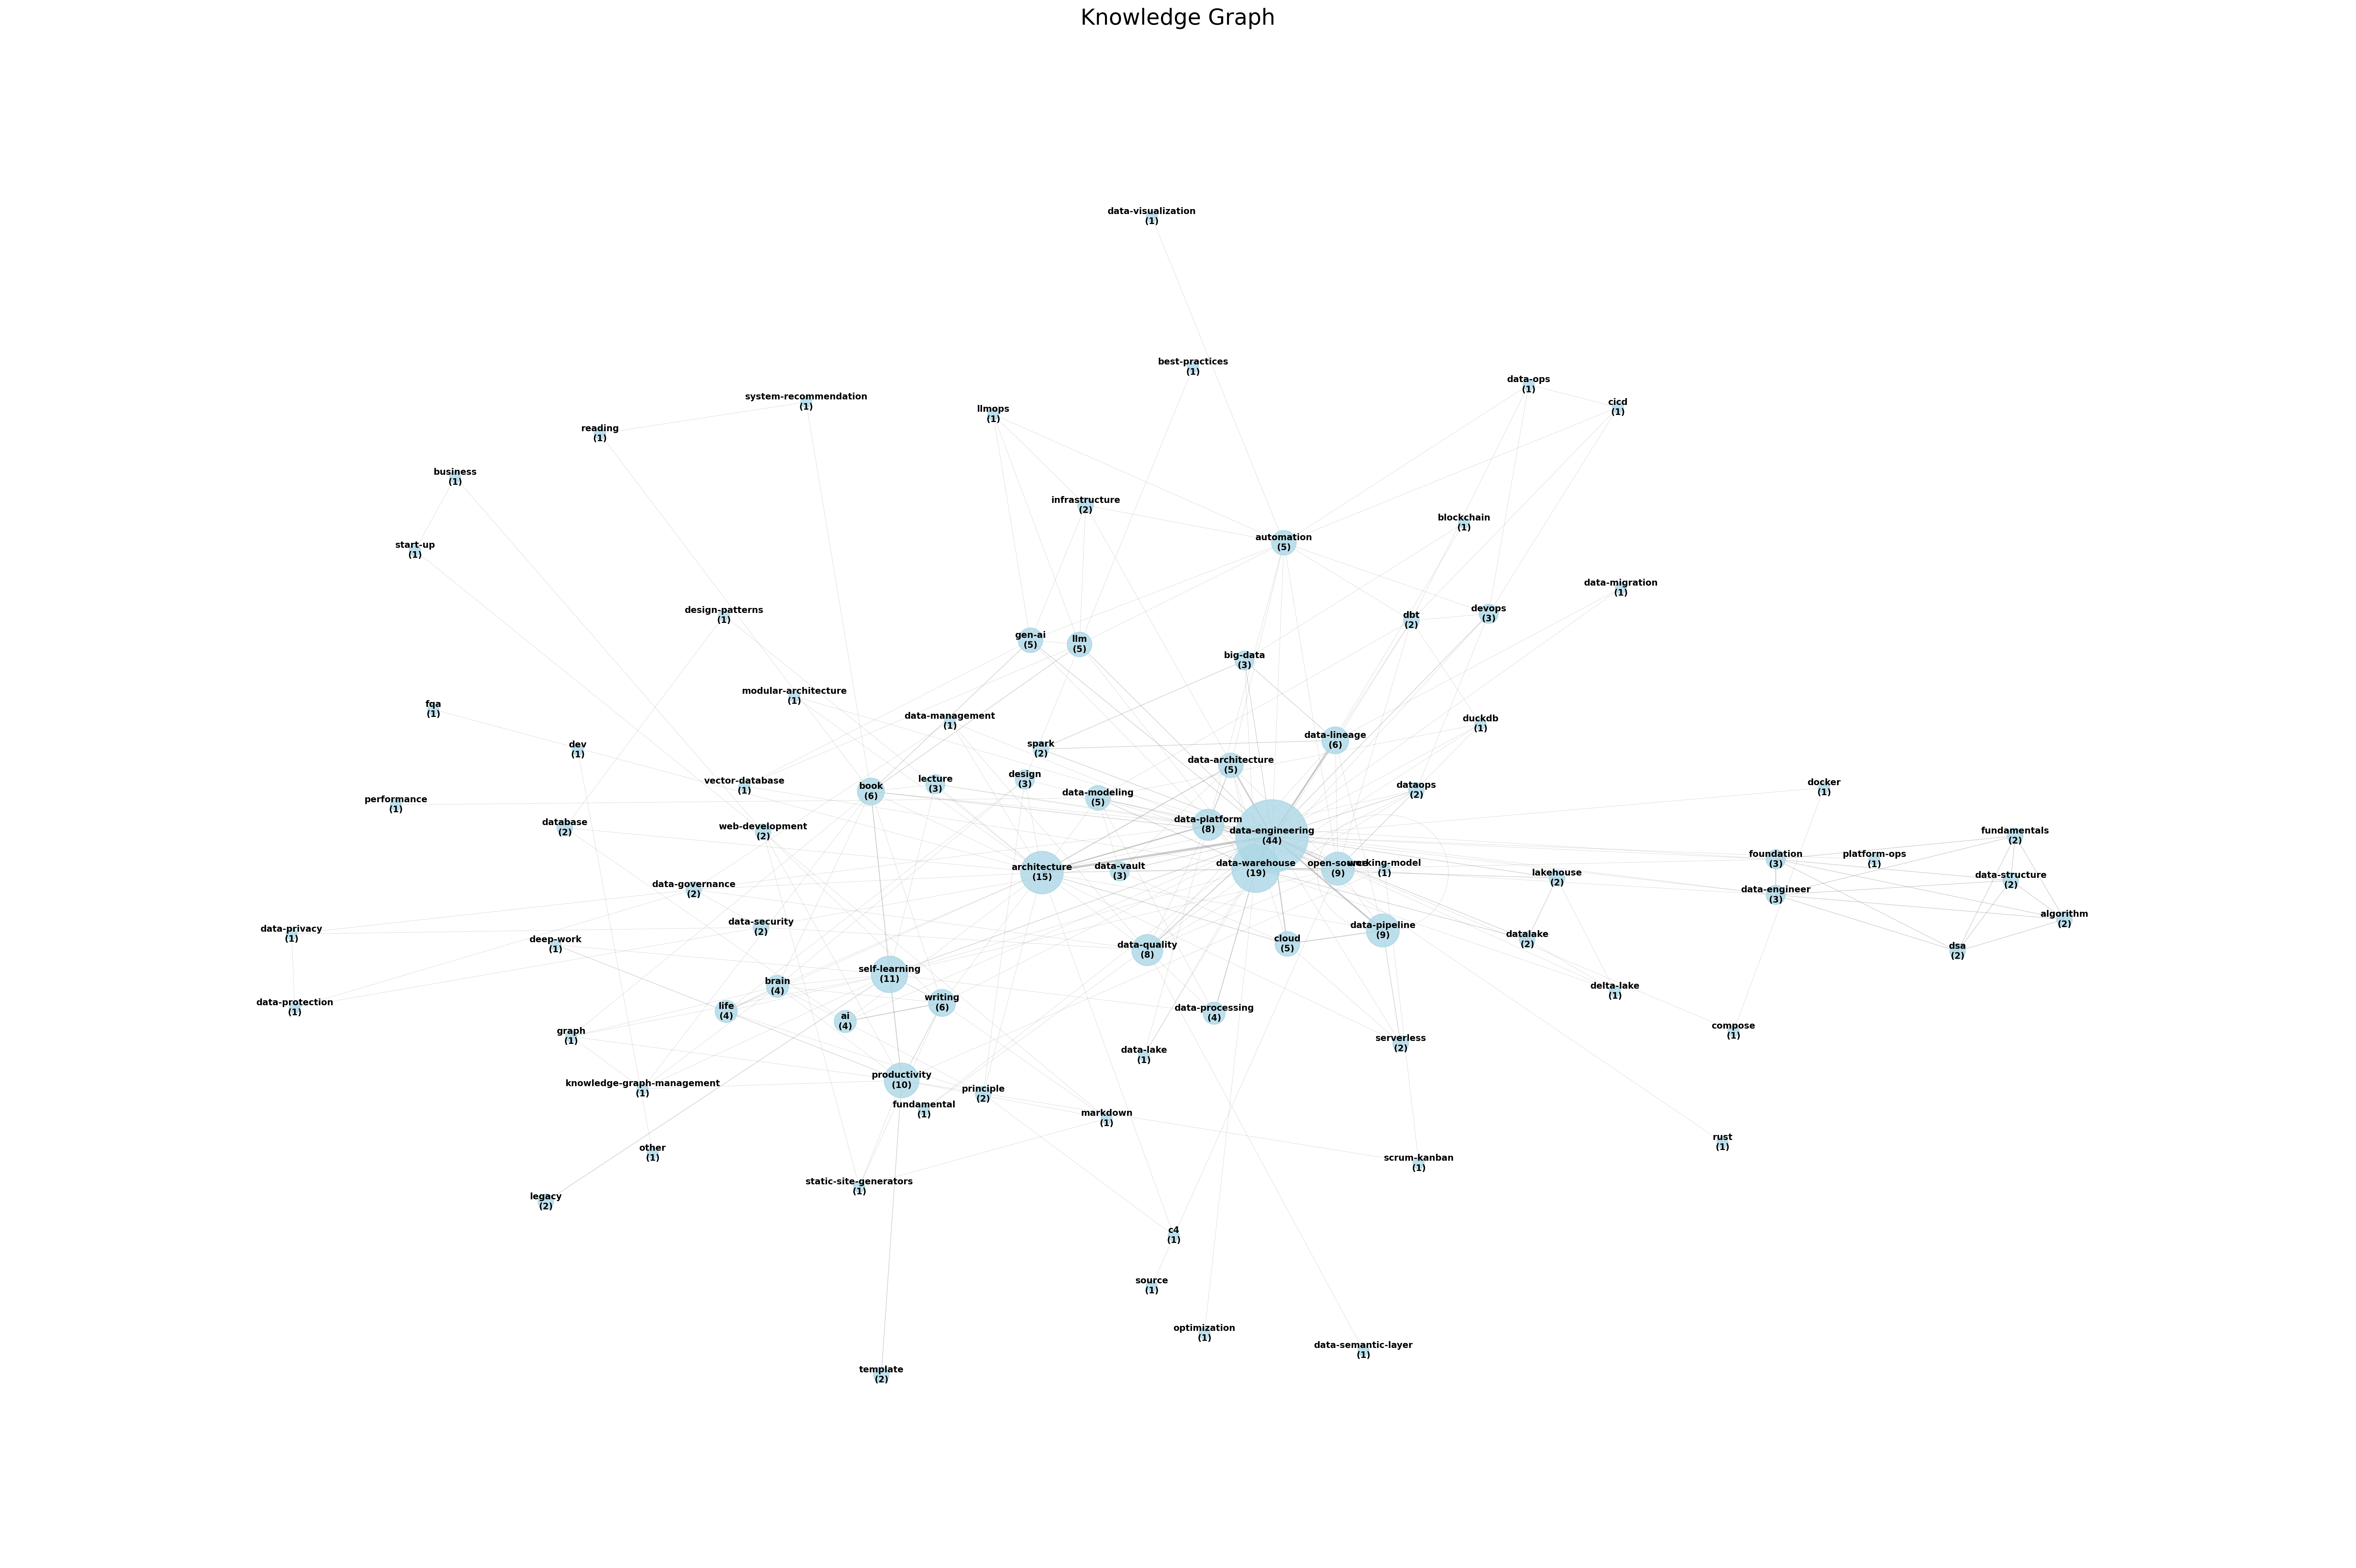
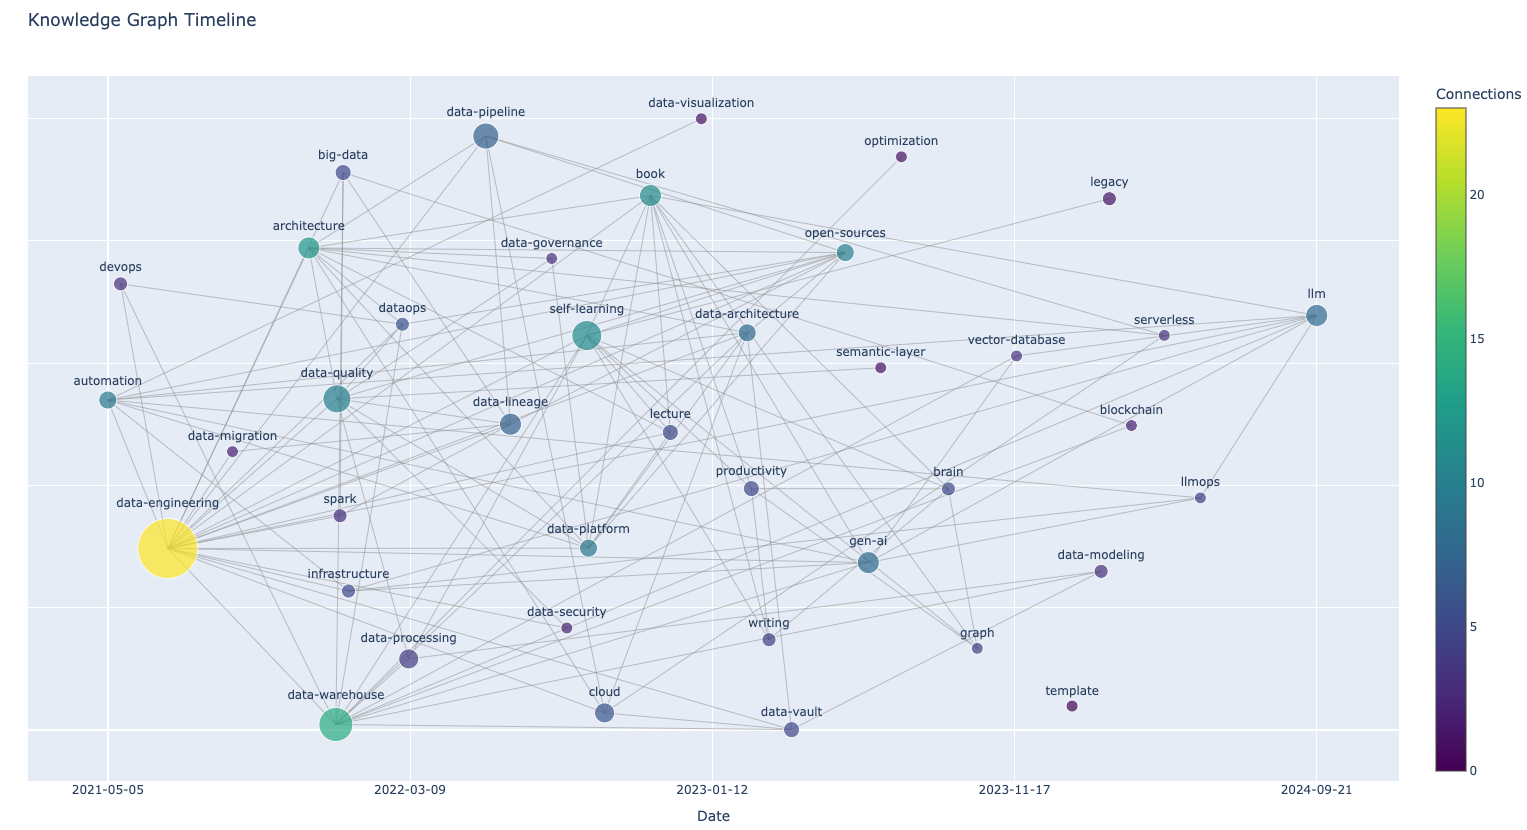
It helps me to visualize and analyze data as a graph for last few years of working in #DataEngineering and #DataScience. I have been working on #knowledge-graph-brain for last few months and I am very excited to share my thoughts on it.

Interactive Knowledge Graph Brain
The interactive knowledge graph brain is a tool that allows you to explore and visualize your knowledge graph. It is a web-based tool that allows you to interact with your knowledge graph and explore it.

Call to Action
If you are interested in learning more about knowledge graph brain, I would recommend you to check out the book and the interactive knowledge graph brain. You can find the book on my website at de-book.
You can use such tool like Obsidian, Customized-app to visualize your brain, and improve your productivity.
Update 2025-05-30, generate knowledge graph from text
By using Python Script Example > here to generate the concatenated text file and use it for LLM prompting input, I can generate the knowledge graph from the text in order to visualize it and demonstrate the correlations between topics - mapping of contents.
Entity/Vertex] Edge[Edge
Relationship/Link] end %% Knowledge Graph Definition subgraph Knowledge Graph Definition KG[Knowledge Graph] Information[Information] KG -->|Consists of| Node KG -->|Consists of| Edge KG -->|Structured representation of| Information end %% Second Brain System subgraph Second Brain System SecondBrain[A Second Brain] MoC[Mapping of Contents
MoC] KGIB[Knowledge Graph
in Brain KGIB] PersonalKnowledge[Personal Knowledge] Visualization[Structured & Visual
Visualization] KGBook[Knowledge Graph Brain Book] InteractiveTool[Interactive Knowledge
Graph Brain Tool] Ontology[Ontology] PARA[PARA Method] NoteTakingTools[Note Taking Tools
Obsidian, etc.] ConnectedThoughts[Connected Thoughts] SecondBrain -->|Uses| MoC SecondBrain -->|Uses| KGIB SecondBrain -->|Organizes & Shares using| Visualization SecondBrain -->|Can use| PARA MoC -->|Uses concepts from| Ontology MoC -->|Uses concepts from| Node MoC -->|Uses concepts from| Edge KGIB -->|Uses| KG KGIB -->|Organizes & Shares| PersonalKnowledge KGIB -->|Enables| Visualization KGIB -->|Visualizes| ConnectedThoughts KGBook -->|Explains building| KGIB InteractiveTool -->|Explores & Visualizes| KGIB SecondBrain -->|Can be built with| NoteTakingTools end %% Data Engineering subgraph Data Engineering DE[Data Engineering] DP[Data Platform] DM[Data Modeling] DV2[Data Vault 2.0] DL[Data Lineage] DQ[Data Quality] DW[Data Warehouse] DLake[Data Lake] Lakehouse[Lakehouse] DPipeline[Data Pipeline] ETL[ETL] DTransform[Data Transformation] DIngestion[Data Ingestion] DG[Data Governance] DAG[Directed Acyclic Graph
DAG] Datapods[Datapods
Open Source Tools] SL[Semantic Layer] TechStack[Tech Stack
Spark, Airflow, dbt, SQL, Cloud, Python, Rust] DataOps[DataOps] SupportOps[Support Ops
DevOps, CloudOps, SecOps] ModArch[Modular Architecture] NoLowCode[No/Low Code Platform] DMLineageMethods[Data Lineage Methods
Parsing, Tagging, Pattern] LLM_DE[LLM Integration
e.g., Handbook, Jupyter] DeltaLake[Delta Lake] Workflow[Workflow
Data, Analytics, AI] DE -->|Encompasses| DP DE -->|Encompasses| DM DE -->|Encompasses| DPipeline DE -->|Encompasses| DIngestion DE -->|Encompasses| DG DE -->|Encompasses| DataOps DE -->|Encompasses| TechStack DE -->|Encompasses| ModArch DE -->|Encompasses| NoLowCode DPipeline -->|Includes| DTransform DPipeline -->|Includes| ETL DPipeline -->|Supports| DL DM -->|Involves| DW DM -->|Involves| DV2 DM -->|Involves| SL DM -->|Involves| Lakehouse DL -->|Visualized as| DAG DL -->|Ensures| DQ DL -->|Uses| DMLineageMethods DG -->|Governs| DL DG -->|Governs| DQ DAG -->|Consists of| Node DAG -->|Consists of| Edge ETL -->|Performs| DTransform ETL -->|Populates| DW ETL -->|Relates to| Node ETL -->|Relates to| Edge DW -->|Requires| DTransform DW -->|Requires| DM DLake -->|Evolves into| Lakehouse Datapods -->|Supports| DE SL -->|Represents| Information TechStack -->|Powers| DE DataOps -->|Integrates with| SupportOps ModArch -->|Supports| Workflow NoLowCode -->|Simplifies| DPipeline LLM_DE -->|Enhances| TechStack LLM_DE -->|Enhances| DE Lakehouse -->|Uses| DeltaLake DeltaLake -->|Provides| Information end %% Cross-subgraph connections KG -->|Used by| KGIB Node -->|Used in structure of| DAG Edge -->|Used in structure of| DAG MoC -->|Related to concept of| DIngestion DE -->|Author's background influences| SecondBrain Ontology -->|Uses concepts from| KG KG -->|Enables| Visualization
How to simply create a Knowledge Graph
- Step 1: Prepare the data: collect your knowledge documents and organize them in a structured format. example: markdown files, pdf, word, etc.
- Step 2: Input into LLM System: use NotebookLM to input your file and ask for the knowledge graph with mermaid syntax.
- Step 3: Visualize the knowledge graph: use Mermaid Live Editor to visualize the knowledge graph.
- Step 4-n: Tuning: iteratively refine the knowledge graph by adding more context and details of your thoughts.
Ref: Applying Knowledge Graph in Gen AI Pipeline
Knowledge Graph Brain is a book that explains how to build a knowledge graph brain. The book is divided into three parts:
A knowledge graph is a structured representation of information that shows relationships between different concepts, entities, and data points. It uses nodes to represent entities and edges to represent the relationships between them.
How to build a knowledge graph?:
- Identify the domain and scope (e.g., data pipelines)
- Collect and prepare relevant data (e.g., ETL processes)
- Define entities and relationships (e.g., data modeling)
- Create a schema or ontology (e.g., database schema design)
- Populate the graph with data (e.g., data ingestion)
- Implement tools for querying and visualization (e.g., Apache Spark)
- Organizing personal knowledge into a graph structure (e.g., data warehousing)
- Identifying key concepts and their relationships (e.g., entity-relationship diagrams)
- Using tools like note-taking apps or specialized software (e.g., Apache Airflow)
- Continuously updating and refining the graph (e.g., data governance)
- Implementing methods to query and retrieve information (e.g., SQL)
- Use a consistent tagging or categorization system (e.g., data cataloging)
- Regularly review and update the graph (e.g., data quality management)
- Experiment with different visualization tools (e.g., Tableau)
- Analyze the current structure and identify areas for improvement (e.g., data profiling)
- Add personal context and additional connections (e.g., metadata management)